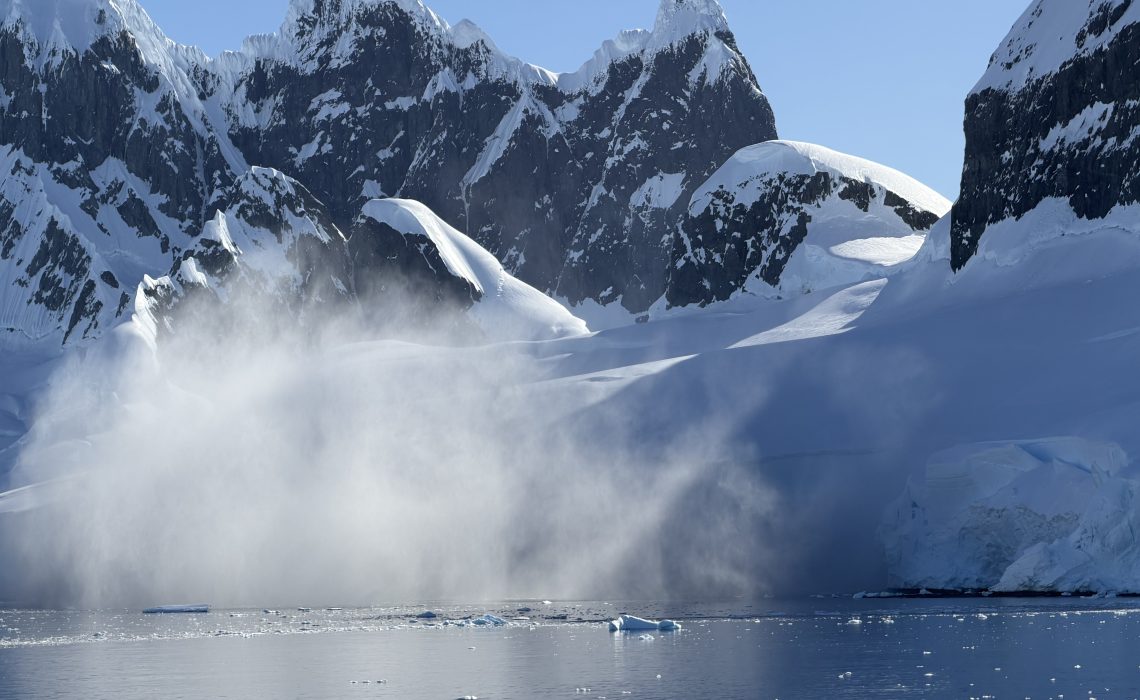
Deep beneath the vast, white expanse of Antarctica lies a world few will ever see – a landscape of jagged mountain ranges, deep-cut canyons, and ancient valleys. For decades, scientists have been working to “peel back” the ice to understand what lies beneath. Recently, a monumental milestone was reached with the release of Bedmap3, the most detailed map of the Antarctic continent to date.
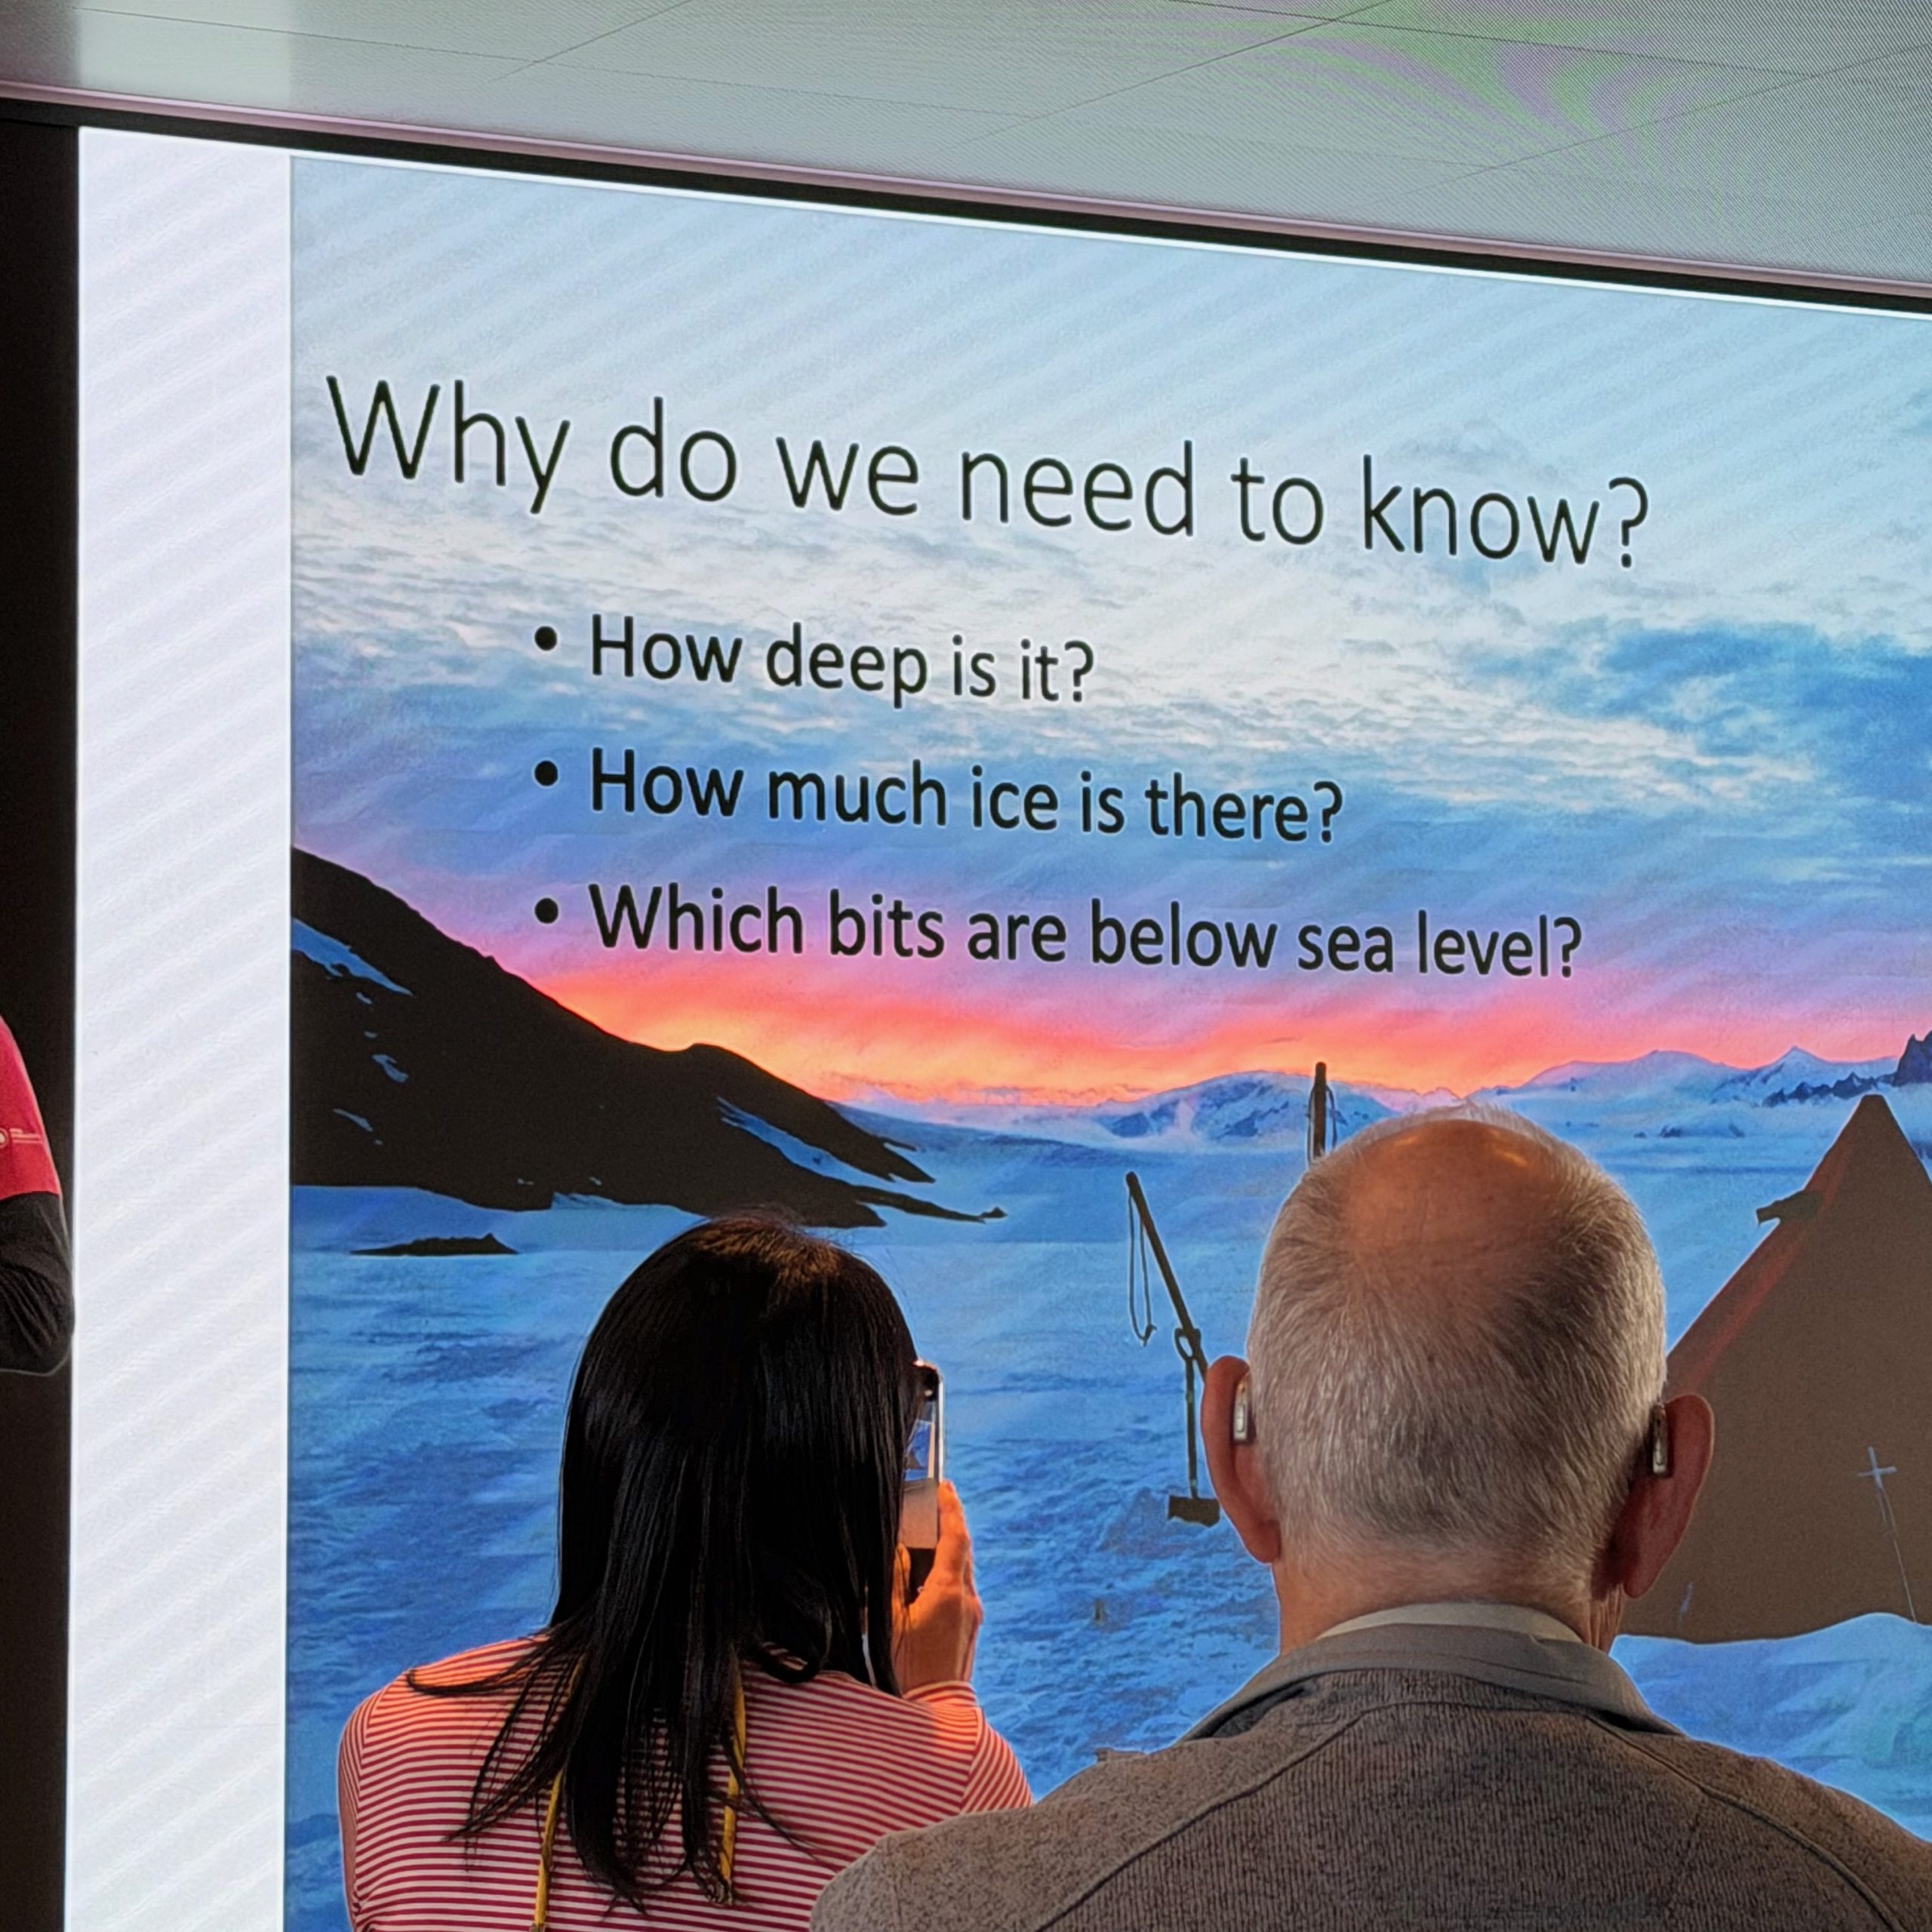
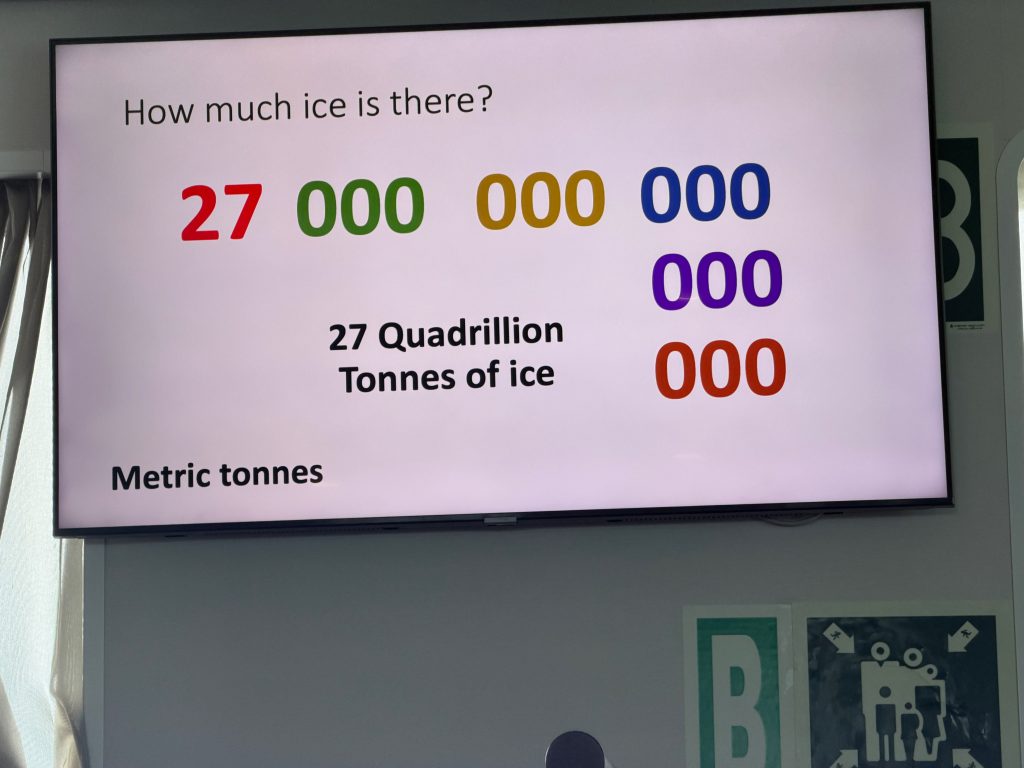
I was fortunate enough to attend a presentation by Dr. Peter Fretwell where he shared some of the results of this groundbreaking work. Listening to the sheer scale of the data collected by the British Antarctic Survey (BAS) and their international partners, it’s clear that this research is far more than a cartographic achievement. It is a vital tool for understanding our planet’s future. What I love about this type of research is it’s all about facts with little hype and conjecture!
Audio introduction above
From Sketches to High-Definition: The Evolution of Bedmap
Mapping a continent covered by miles of ice is no small feat. Bedmap3 is the culmination of sixty years of data, collected from planes, satellites ships and surprisingly dog-drawn sleds. But it represents a massive leap forward from its predecessors.
- Bedmap1 (2001): The first major attempt to consolidate Antarctic data. It provided our first real “big picture” of the bedrock but had massive gaps where data simply didn’t exist.
- Bedmap2 (2013): A significant upgrade that incorporated 25 million measurements. It revealed for the first time that large parts of the Antarctic bed were well below sea level, increasing our understanding of the continent’s vulnerability.
- Bedmap3 (2025): The current gold standard. By doubling the data points of Bedmap2 to over 80 million, Fretwell and his team have filled in critical “blind spots” in East Antarctica and the Antarctic Peninsula.
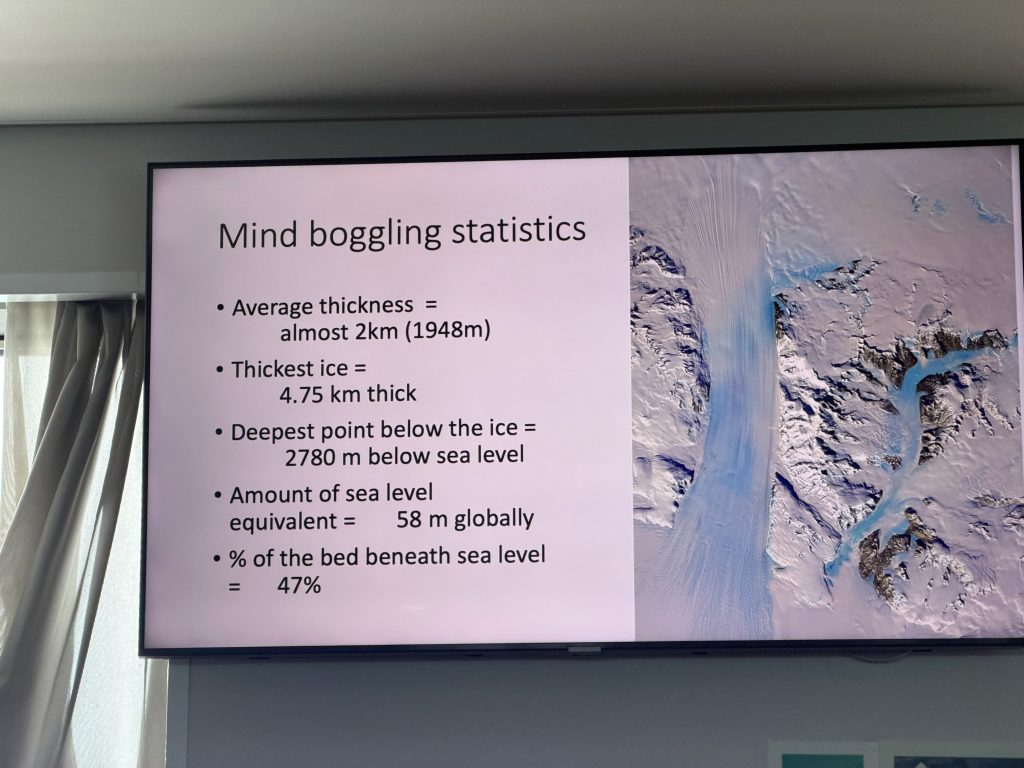
One of the most staggering finds in this third iteration is a canyon in Wilkes Land where the ice is 4,757 meters thick. To put that in perspective, that is roughly 15 times the height of the Shard in London.
Why the “Lumps and Bumps” Matter
You might wonder why we need to know the shape of the rock under two miles of ice. Dr. Hamish Pritchard, a lead author on the study, uses a brilliant analogy: syrup on a rock cake.
If you pour syrup over a bumpy cake, the ridges hold the syrup back, while the hollows and smooth bits let it slide off quickly. Antarctica’s ice behaves the same way. The newly mapped ridges act as “pins” that hold the ice sheets in place. Conversely, the deep, smooth troughs are “highways” where ice can accelerate toward the ocean as the climate warms.
Bedmap3 has revealed that the Antarctic Ice Sheet is thicker than we realised, but with more of it resting on a bed below sea level. This makes the ice more vulnerable to melting from below as warm ocean water creeps into those deep subglacial valleys but as Fretwell cautiously comments, ‘What Bedmap3 is showing us is that we have got a slightly more vulnerable Antarctica than we previously thought’.
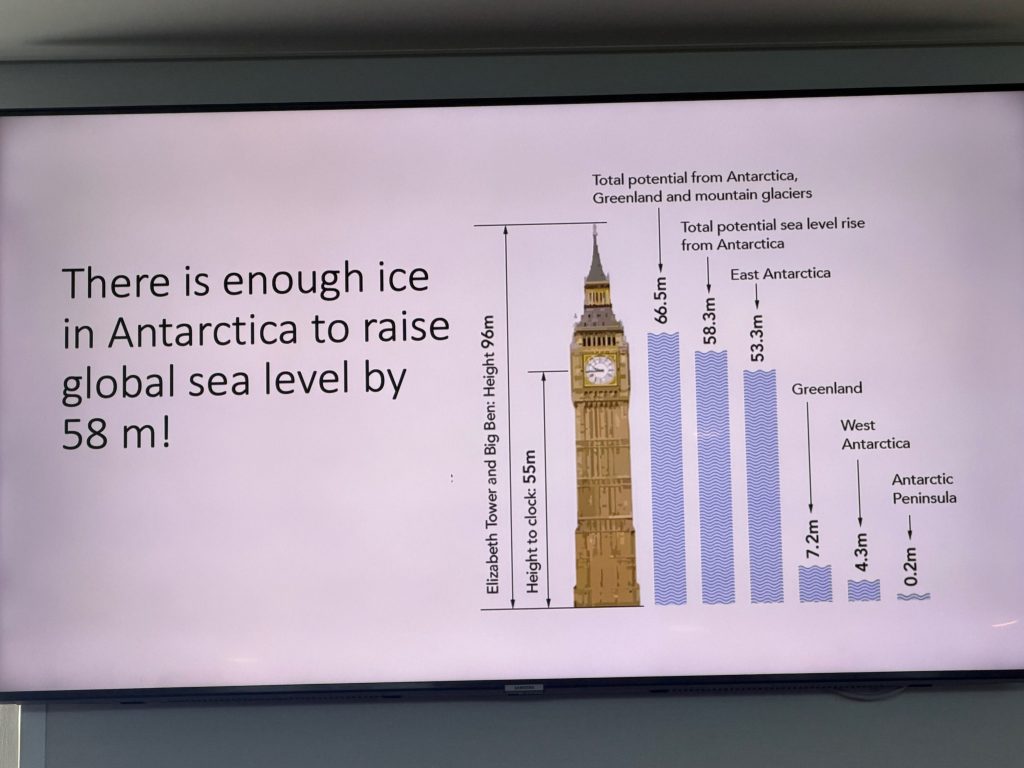
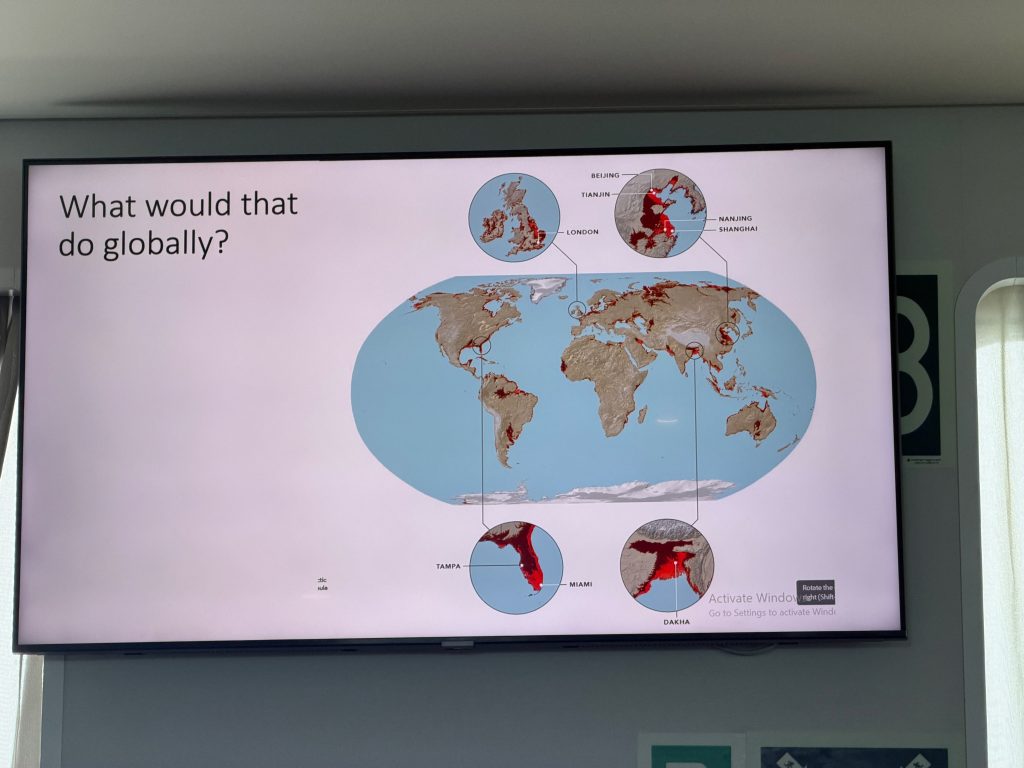
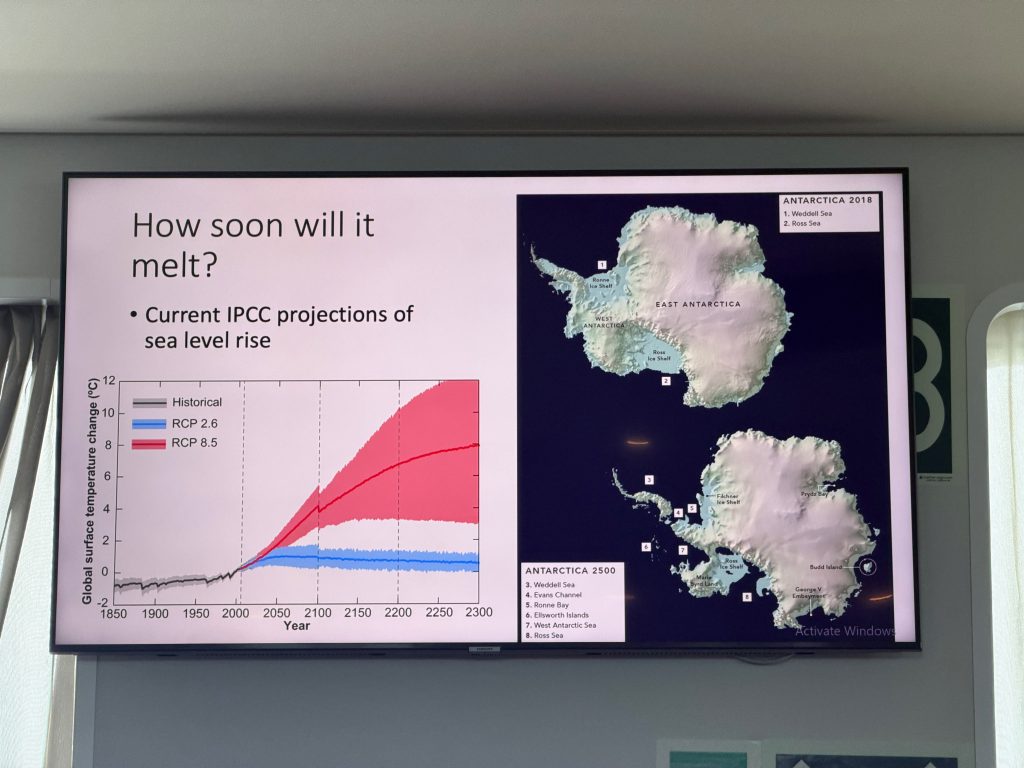
We looked at the facts and statistics Bedmap3 has revealed but also the potential rises in sea levels as Antarctica continues to melt, how that affects the different areas of the world and IPCC projections of the timeline.
A Fragile Balance: The Emperor Penguin’s Crisis
While Bedmap3 looks at the bedrock, Peter Fretwell’s other primary focus is looking at the ice from above – specifically, how its disappearance affects the continent’s most iconic inhabitants: Emperor Penguins. Look out for my next article, about how he discovered we can spot penguins from space.
Emperor Penguins are unique because they breed on land-fast sea ice – ice that is firmly attached to the coast. They need this platform to remain stable from May to December/January. If the ice breaks up too early, the chicks, which haven’t yet grown their waterproof feathers, are forced into the freezing ocean.
The news here is sobering. Recent studies by Fretwell and his colleagues have shown that record-low sea ice levels have led to some catastrophic breeding failures. In some regions, like the Bellingshausen Sea, entire colonies have seen nearly zero survival rates for their chicks in recent years.
The Connection
The link between the two areas of research is clear – as we gain a more precise understanding of how the bedrock influences ice loss, we see a more urgent picture of the threat to Antarctic wildlife. Current models suggest that if warming continues at its present rate, 99% of Emperor Penguin colonies could be virtually extinct by the end of the century. New data from 2024 and 2025 suggests that populations in certain sectors are declining twice as fast as previously predicted.
Looking Ahead
The work of the British Antarctic Survey isn’t just about cold data and distant maps; it’s about the reality of a changing world. Knowing exactly where the ice is most vulnerable allows us to better understand the timeline we are working with.
Bedmap3 gives us the “blueprint” of the continent, allowing for much more accurate predictions of sea-level rise and environmental shifts. The mountains and canyons of Antarctica may be hidden, but their influence on our global climate and the survival of species like the Emperor Penguin is very much in plain sight.
References & Further Reading
- Pritchard, H.D., Fretwell, P.T., et al. (2025). “Bedmap3 updated ice bed, surface and thickness gridded datasets for Antarctica.” Scientific Data. Link to British Antarctic Survey Project Page
- Fretwell, P.T. (2024). “A 6-year assessment of low sea-ice impacts on emperor penguins.” Antarctic Science.
- Fretwell, P.T., & Bamford, C. (2025). “Regional emperor penguin population declines exceed modelled projections.” Communications Earth & Environment.
- British Antarctic Survey (2025). “New map of landscape beneath Antarctica unveiled.” Official Press Release
Every Click Counts: Fueling a Greener Future, One Story at a Time. Our planet whispers a plea for change, every day. Every small step we take – from reusable bags to conscious consumption – ripples outwards, creating a wave of hope. Let’s rewrite the story of our planet, one click at a time. Join me in making a difference. I believe in the power of storytelling. By sharing inspiring environmental initiatives and practical tips, I aim to amplify the voices making a difference. Imagine a world where everyone is empowered to take action, one small change at a time. Together, we can create that reality. Your support is more than just a donation. By clicking the “Donate” button (top right corner), you become a partner in this mission. Your contribution fuels this platform, allowing me to share even more impactful stories and empower a global community.